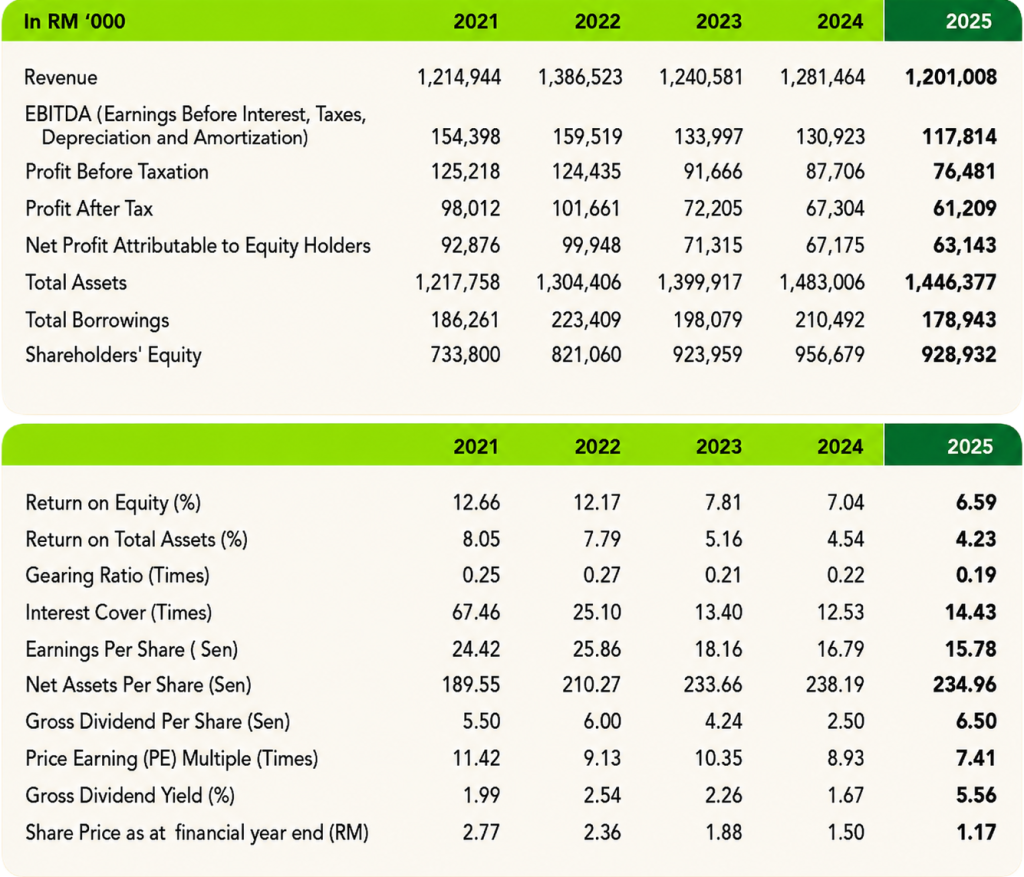
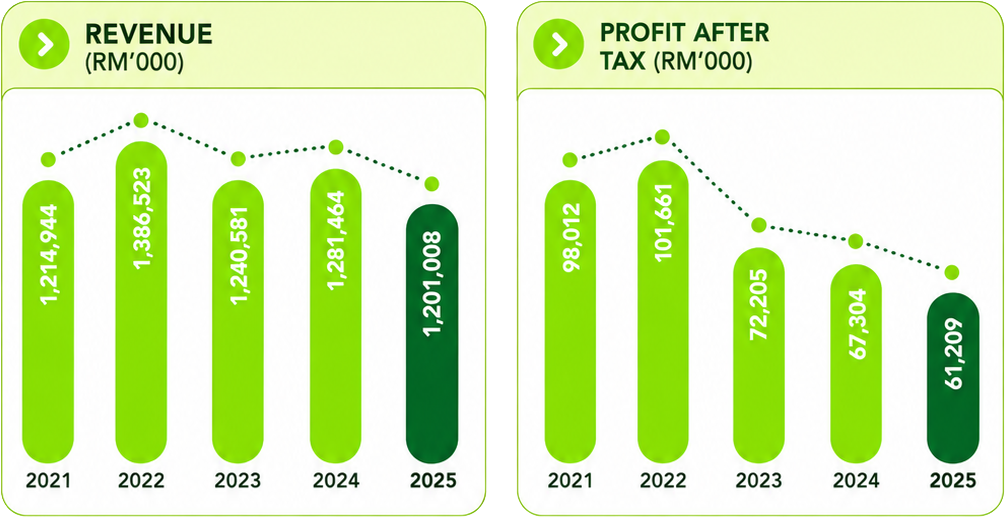
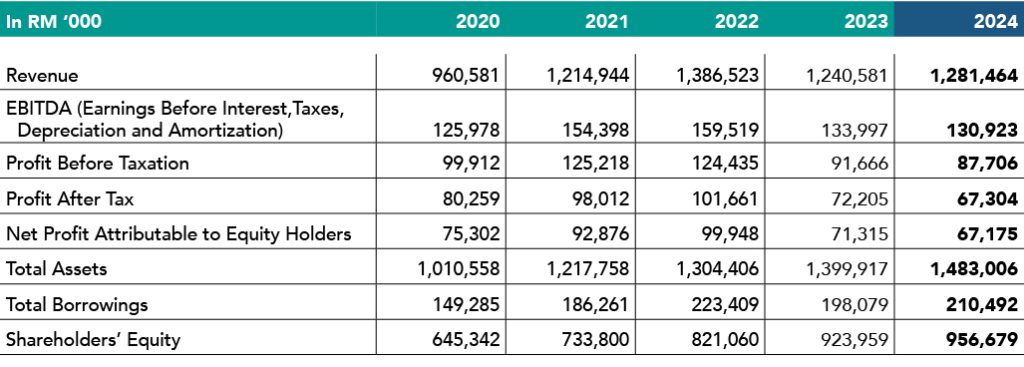
EBITDA (Earnings Before Interest, Taxes, Depreciation, and Amortization)
68,085
73,051
100,301
125,978
154,398
Profit Before Taxation
50,682
51,972
75,452
99,912
125,218
Profit After Tax
42,707
43,610
63,893
80,259
98,012
Net Profit Attributable to Equity Holders
41,897
43,682
61,849
75,302
92,876
Total Assets
685,451
739,312
881,316
1,010,558
1,217,758
Total Borrowings
75,693
126,926
143,036
149,285
186,261
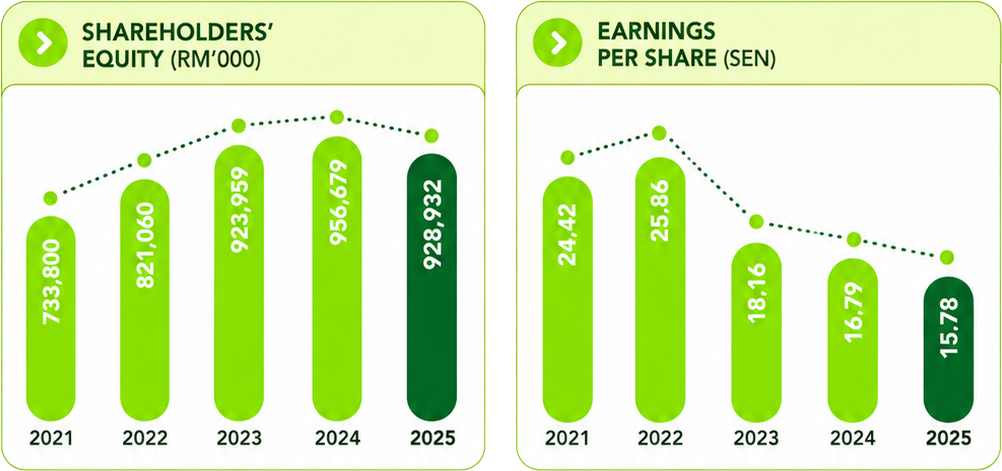
Shareholders’ Equity
466,253
494,848
576,585
645,342
733,800
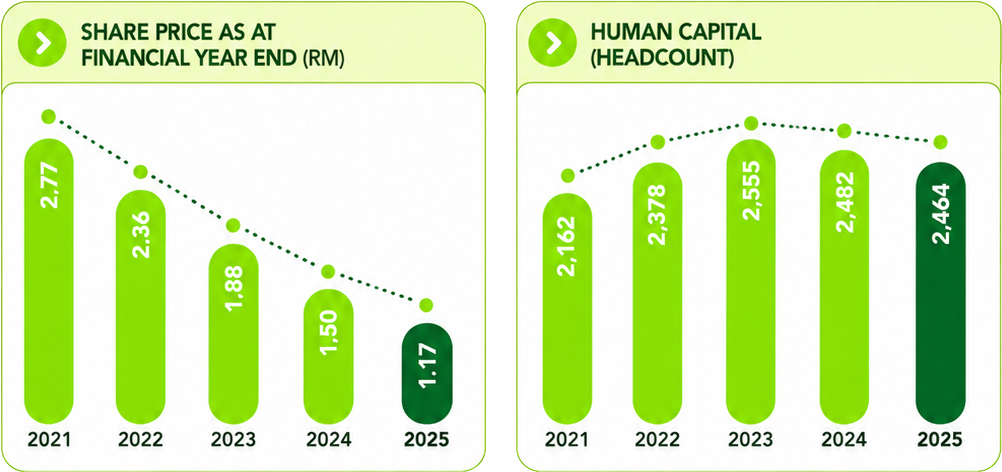
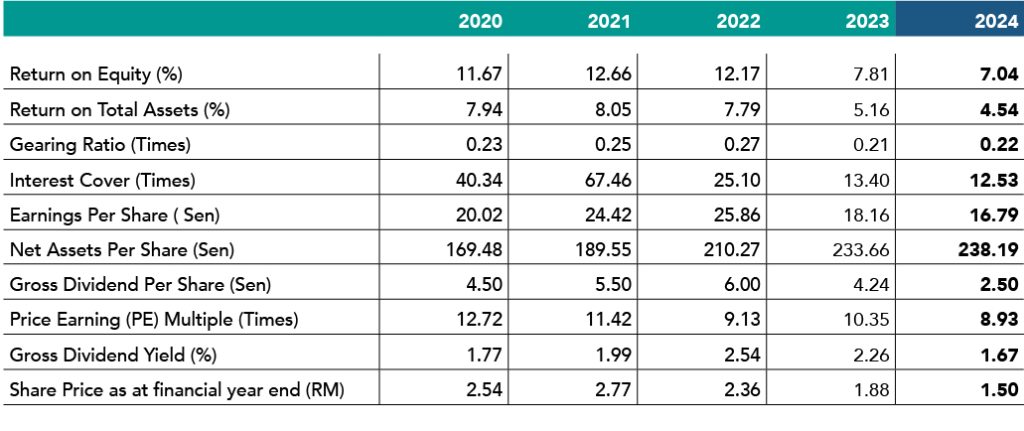
2017
2018
2019
2020
2021
Return on Equity (%)
9.16
8.83
10.73
11.67
12.66
Return on Total Assets (%)
6.23
5.90
7.25
7.94
8.05
Gearing Ratio (Times)
0.16
0.26
0.25
0.23
0.25
Interest Cover (Times)
28.41
15.92
18.18
40.34
67.46
Earnings Per Share (Sen)*
15.94
16.02
17.97
19.97
24.42
Net Assets Per Share (Sen)*
172.35
181.35
156.08
169.48
189.55
Gross Dividend Per Share (Sen)*
4.00
4.00
4.50
4.50
5.50
Price Earning (PE) Multiple (Times)*
13.26
6.87
9.37
12.72
11.42
Gross Dividend Yield (%)*
1.89
3.64
2.67
1.77
1.99
Share Price as at Financial Year End (RM)*
2.12
1.10
1.69
2.54
2.77
Remark: * The prior year earning per share, net assets per share, gross dividend per share, price earning, gross dividend yield and share price is computed based on enlarged number of ordinary shares in issue after adjusting for the effects of bonus issue restrospetively